Solutions — QuickBooks Dashboards
QuickBooks dashboards built for business owners — not accountants.
QuickBooks holds the data, but owners often still struggle to see what is happening quickly. Orivian helps turn accounting data into clearer dashboards, recurring reports, and simple business visibility.
Common reporting problems
What gets in the way of seeing the numbers clearly.
These are the patterns that show up most often when business owners do not have a clean reporting system.
Exporting data to spreadsheets
You pull QuickBooks data into a spreadsheet just to understand what is happening. That extra step should not be required every time.
Reports that require accounting context
Standard QuickBooks reports are built for accountants. Owners often struggle to read them quickly without translation.
Cash flow is hard to see
Knowing where cash stands right now should not require running multiple reports and doing manual math.
Revenue and expense trends are buried
The data exists in QuickBooks, but seeing trends over time requires digging instead of a single glance.
Reporting is reactive, not recurring
You only look at the numbers when something feels off. A recurring reporting workflow changes that.
What Orivian can build
Reporting systems designed around how you run your business.
Every reporting system is built for your actual data structure and the decisions you need to make.
Owner dashboard
A single view of the numbers that matter most to you — revenue, expenses, cash position, and outstanding receivables.
Revenue trend reporting
See how revenue is moving over time without pulling reports manually each time.
Expense category visibility
Understand where money is going by category without opening a full P&L every time.
Cash flow snapshots
A clear picture of cash coming in and going out, updated on a schedule that works for your business.
Monthly reporting workflow
Reports that generate and deliver automatically, so the review happens without manual assembly.
Custom QuickBooks-connected dashboards
Dashboards built specifically for your business that pull from QuickBooks and present data the way you think about your business.
Examples
What a QuickBooks dashboard actually looks like.
Real dashboard views built in DashEase, Orivian’s QuickBooks reporting product — not mockups.
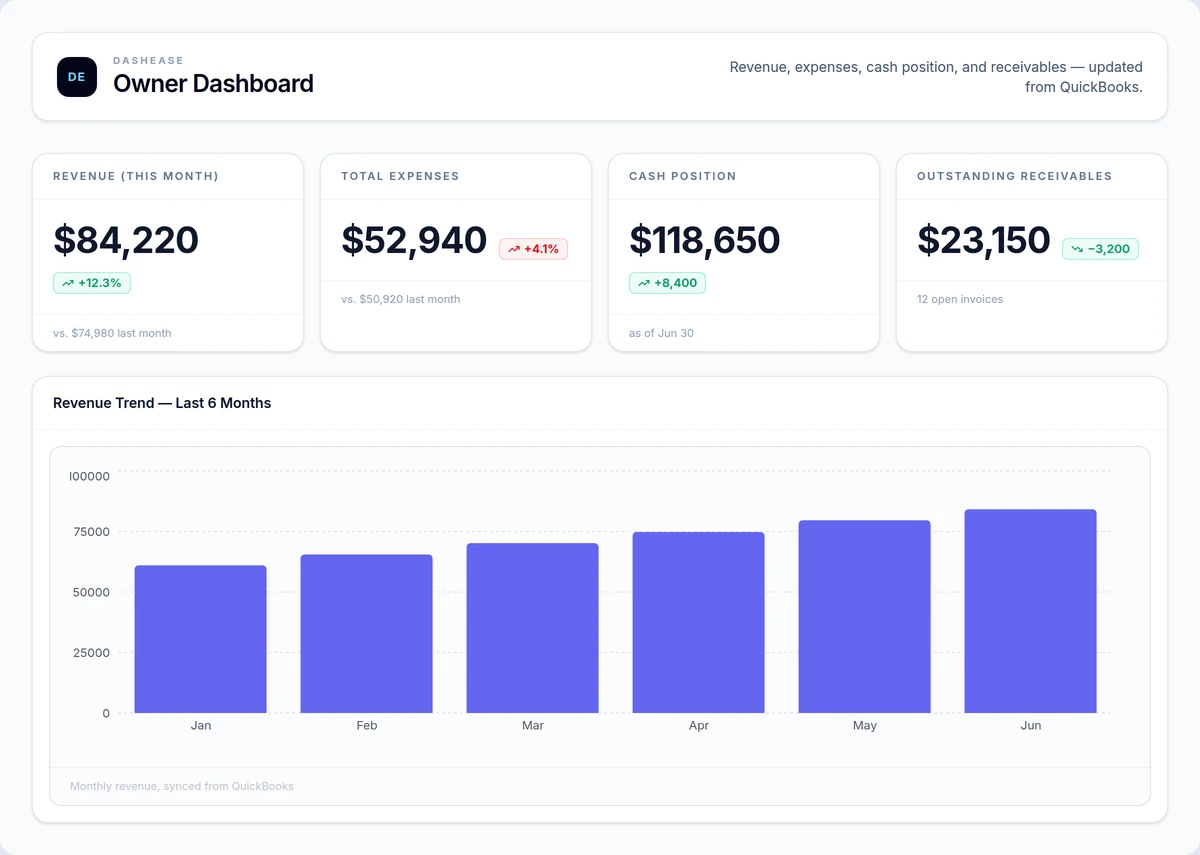
Owner dashboard
Shows whether this month's numbers support hiring, spending, or holding steady — without opening QuickBooks.
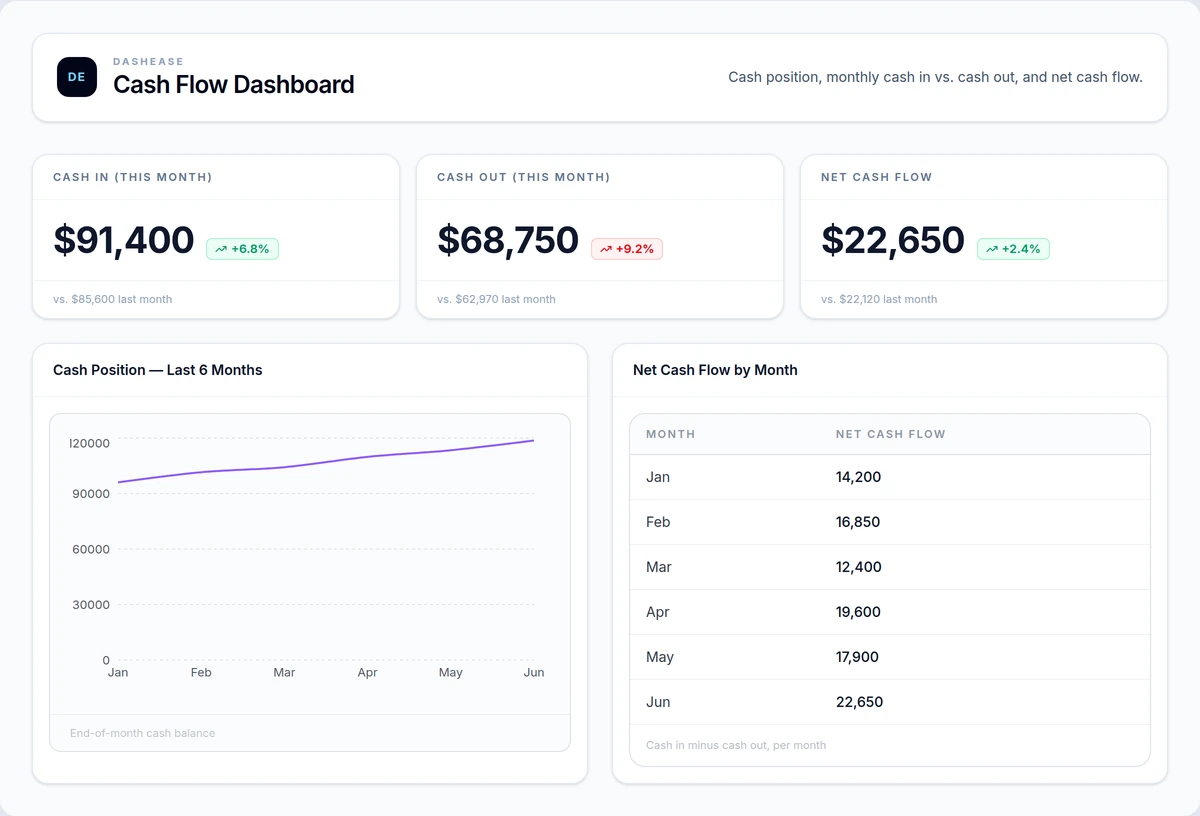
Cash flow dashboard
Flags when cash coming in won't cover payroll and vendor bills before the gap hits your bank balance.
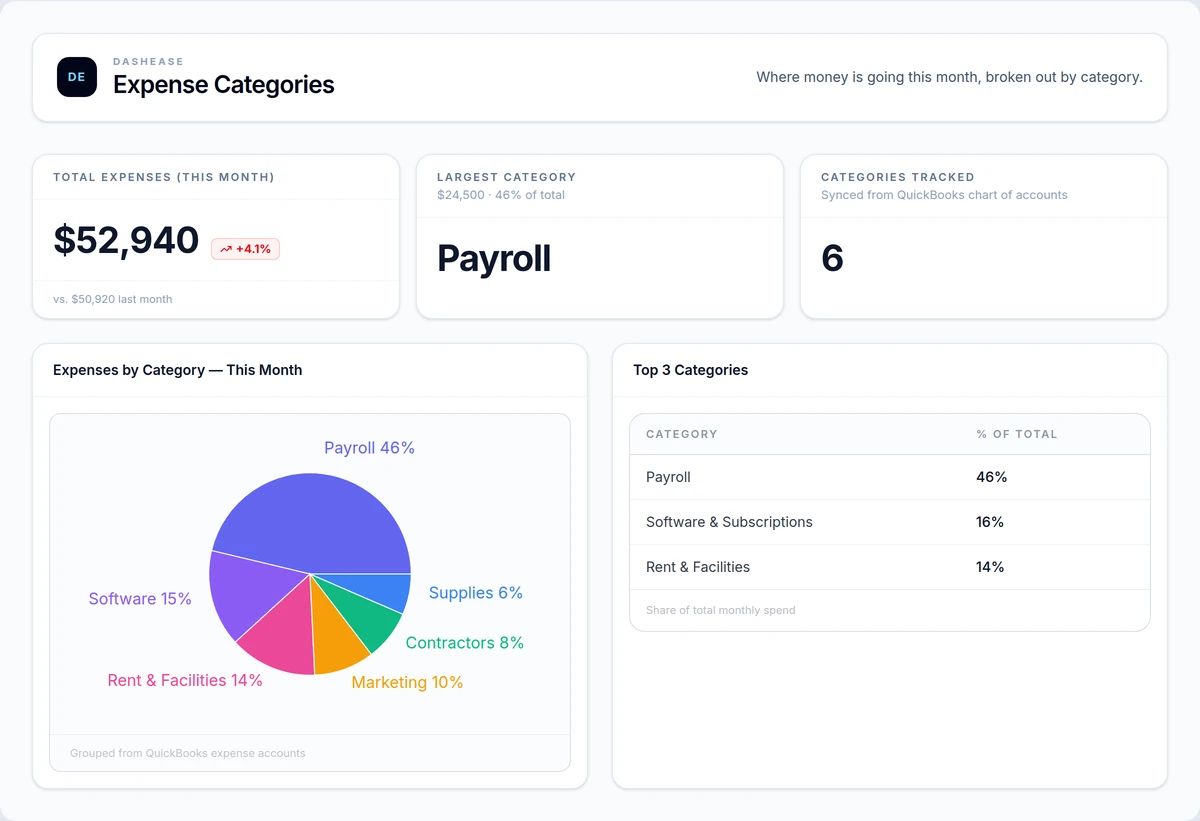
Expense category dashboard
Pinpoints which expense category to cut first when margins tighten.
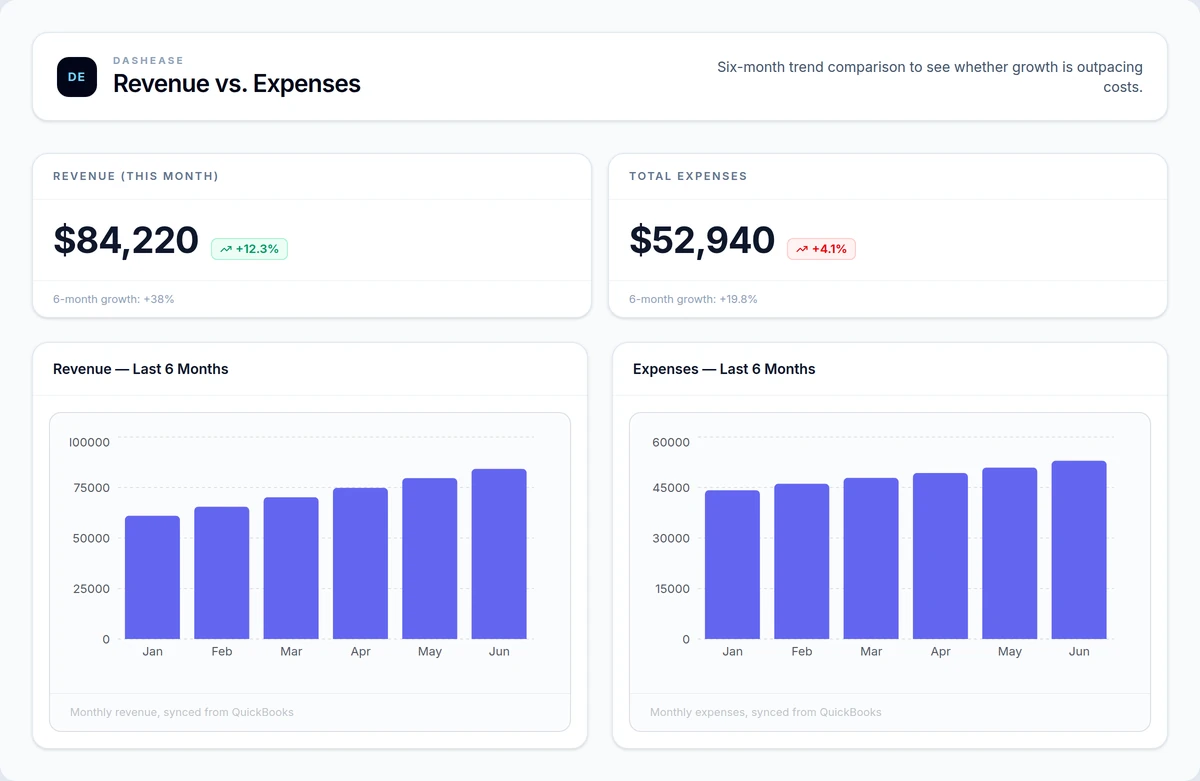
Revenue vs. expenses dashboard
Shows at a glance whether revenue growth is outpacing rising costs, or getting eaten by them.
Related
Related reporting and software pages
DashEase
Orivian's QuickBooks reporting product for clearer owner-level dashboards.
Learn more →7 QuickBooks Dashboard Examples
Real screenshots of owner, cash flow, AR, and job profitability dashboards, each tied to the decision it drives.
Learn more →How to Create a Dashboard in QuickBooks
A step-by-step walkthrough of QuickBooks Online's built-in dashboard, where it stops working, and the upgrade paths from there.
Learn more →Custom Software
Build tools and dashboards around the way your business actually works.
Learn more →Business Process Automation
Automate recurring reports, alerts, and operational handoffs.
Learn more →Dashboard Requirements Worksheet
Define your audience, metrics, data sources, and success criteria before building a dashboard.
Learn more →Free tools
Plan the dashboard before building it.
Use these worksheets to define the metrics, views, and owner questions your reporting system should answer.
Reporting
QuickBooks Dashboard Planner
A planning worksheet for defining the owner-level QuickBooks dashboards and reporting views your business actually needs.
Use this tool →
Reporting
Dashboard Requirements Worksheet
A worksheet for defining the audience, metrics, data sources, filters, alerts, and success criteria before building a dashboard.
Use this tool →
Operations
Operations Audit Checklist
A practical checklist for finding manual work, reporting gaps, handoff issues, and automation opportunities inside your business.
Use this tool →
FAQ
Common questions about QuickBooks dashboards
Can you create custom dashboards in QuickBooks?
QuickBooks Online has a built-in dashboard tab with a handful of preset tiles — income, expenses, profit and loss, and sales. You can reorder those tiles and pick from a small set of chart types, but you cannot add custom metrics, blend data from outside QuickBooks, or build owner-specific views. For most business owners, the native dashboard answers what happened last month, not the specific questions they actually ask. That is where a connected tool like DashEase or a custom build comes in.
What's the difference between QuickBooks reports and a dashboard?
QuickBooks reports are static snapshots — you run a report, read it, and run it again next time. A dashboard is a persistent, visual view that updates automatically and surfaces trends at a glance, without opening a new report each time. Reports are built for accountants who need line-item detail; dashboards are built for owners who need to answer "are we okay?" in ten seconds. Most owners end up exporting reports into spreadsheets just to get dashboard-like visibility — a real dashboard removes that step.
Do I need Power BI to build dashboards from QuickBooks data?
No. Power BI can connect to QuickBooks data, but it requires setting up a data pipeline, learning DAX, and maintaining refresh schedules — significant overhead for most small businesses. Purpose-built tools like DashEase connect to QuickBooks directly and handle the sync automatically, giving you owner-ready dashboards without a BI analyst on staff. Power BI makes sense for larger teams with dedicated data resources; most QuickBooks-based businesses get to a usable dashboard faster with a connected tool or a scoped custom build.
How does DashEase connect to QuickBooks?
DashEase connects directly to QuickBooks Online through Intuit's official API. You authorize the connection once, and DashEase syncs your data on a schedule so dashboards stay current without manual exports or file uploads. From there you build charts and dashboards using the metrics that matter to your business — revenue, expenses, cash flow, and receivables — without touching a spreadsheet. The connection is read-only, so nothing in DashEase writes back to your QuickBooks books.
What does a QuickBooks dashboard project cost?
It depends on the path. DashEase starts free for basic dashboards and scales with paid plans as you need more charts, users, or QuickBooks automation. A scoped consulting engagement — where Orivian defines your metrics, builds custom views, and sets up recurring reporting — typically runs as a fixed-price project rather than an open-ended retainer. The right starting point is a free Opportunity Map, which tells you whether DashEase alone covers your needs or a custom build makes sense.
Start with a free Opportunity Map.
We will look at your current reporting setup and identify the fastest path to cleaner visibility. No commitment required.